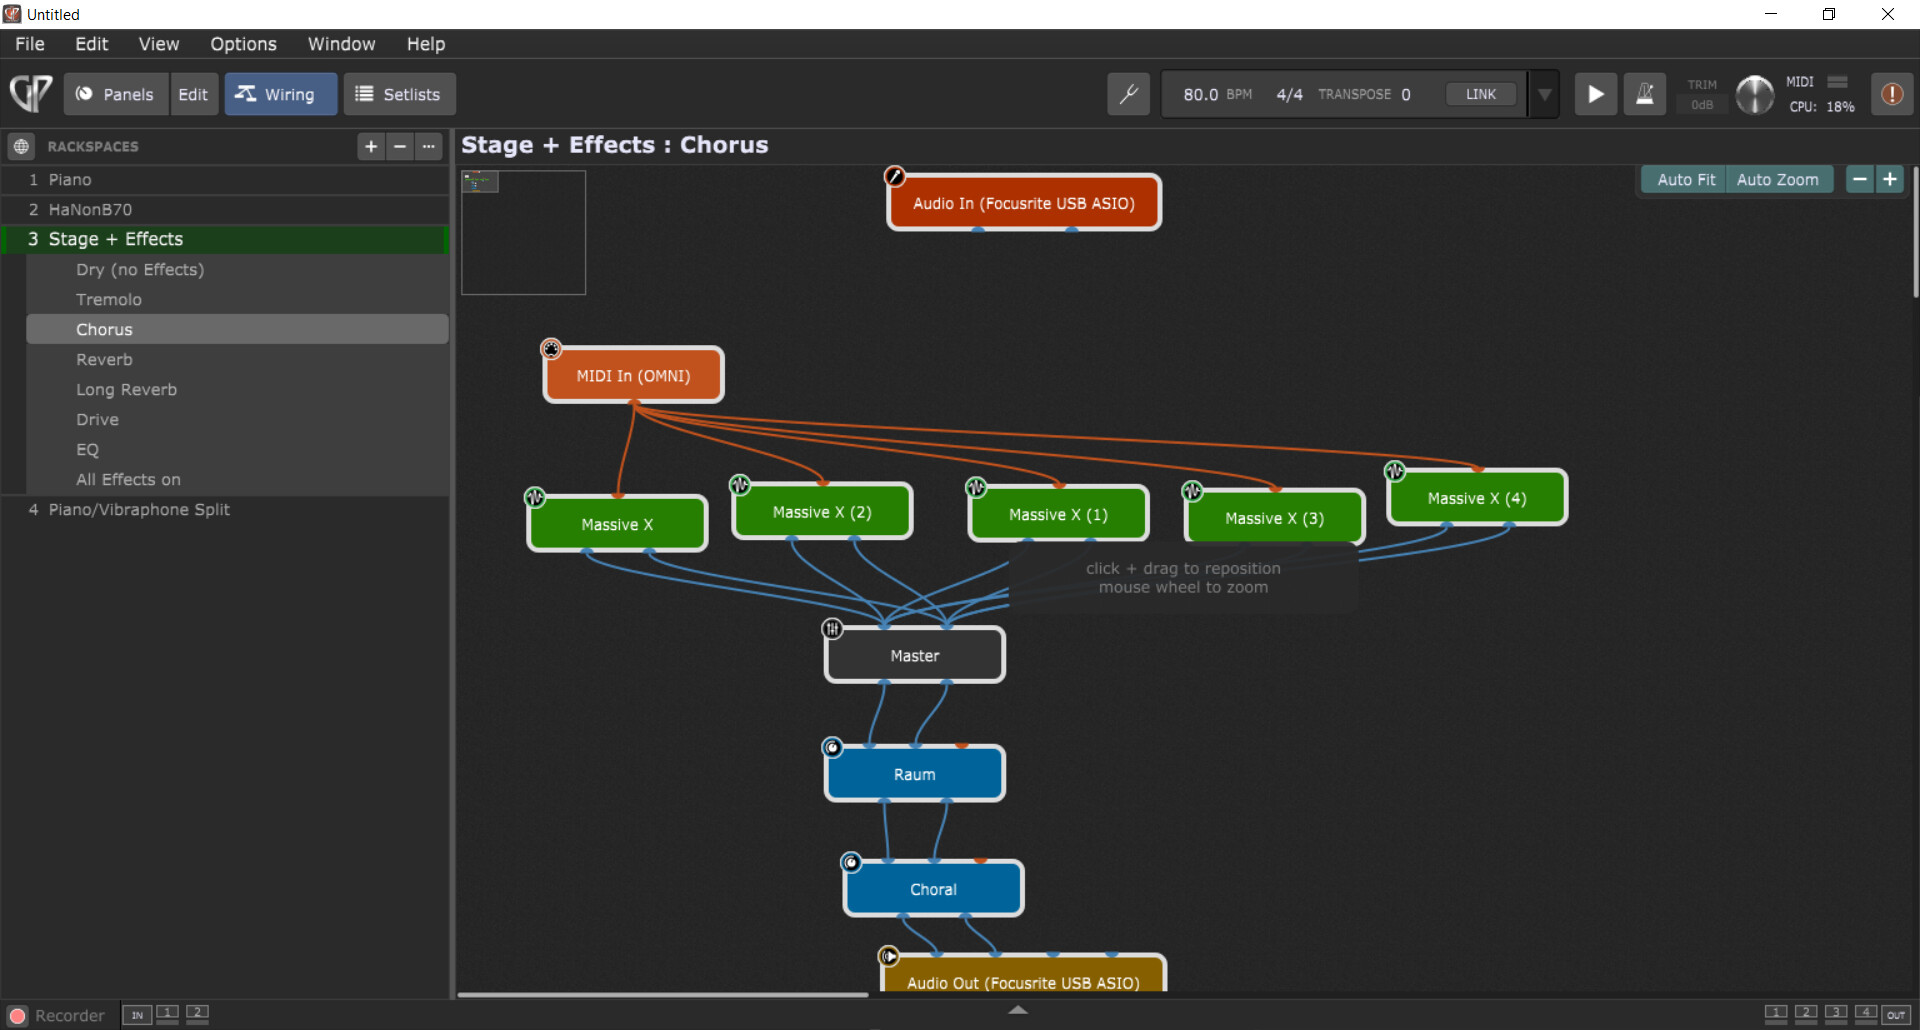
I did some speed checks, and I found out I can run 4 CPU hungry NI Massive X instruments at the same time. I removed the effects, and added a few effects at the end to get the same ‘sound’. However, this was just for a CPU stress test :-).
However, I’m not sure how to interpret the CPU meter.
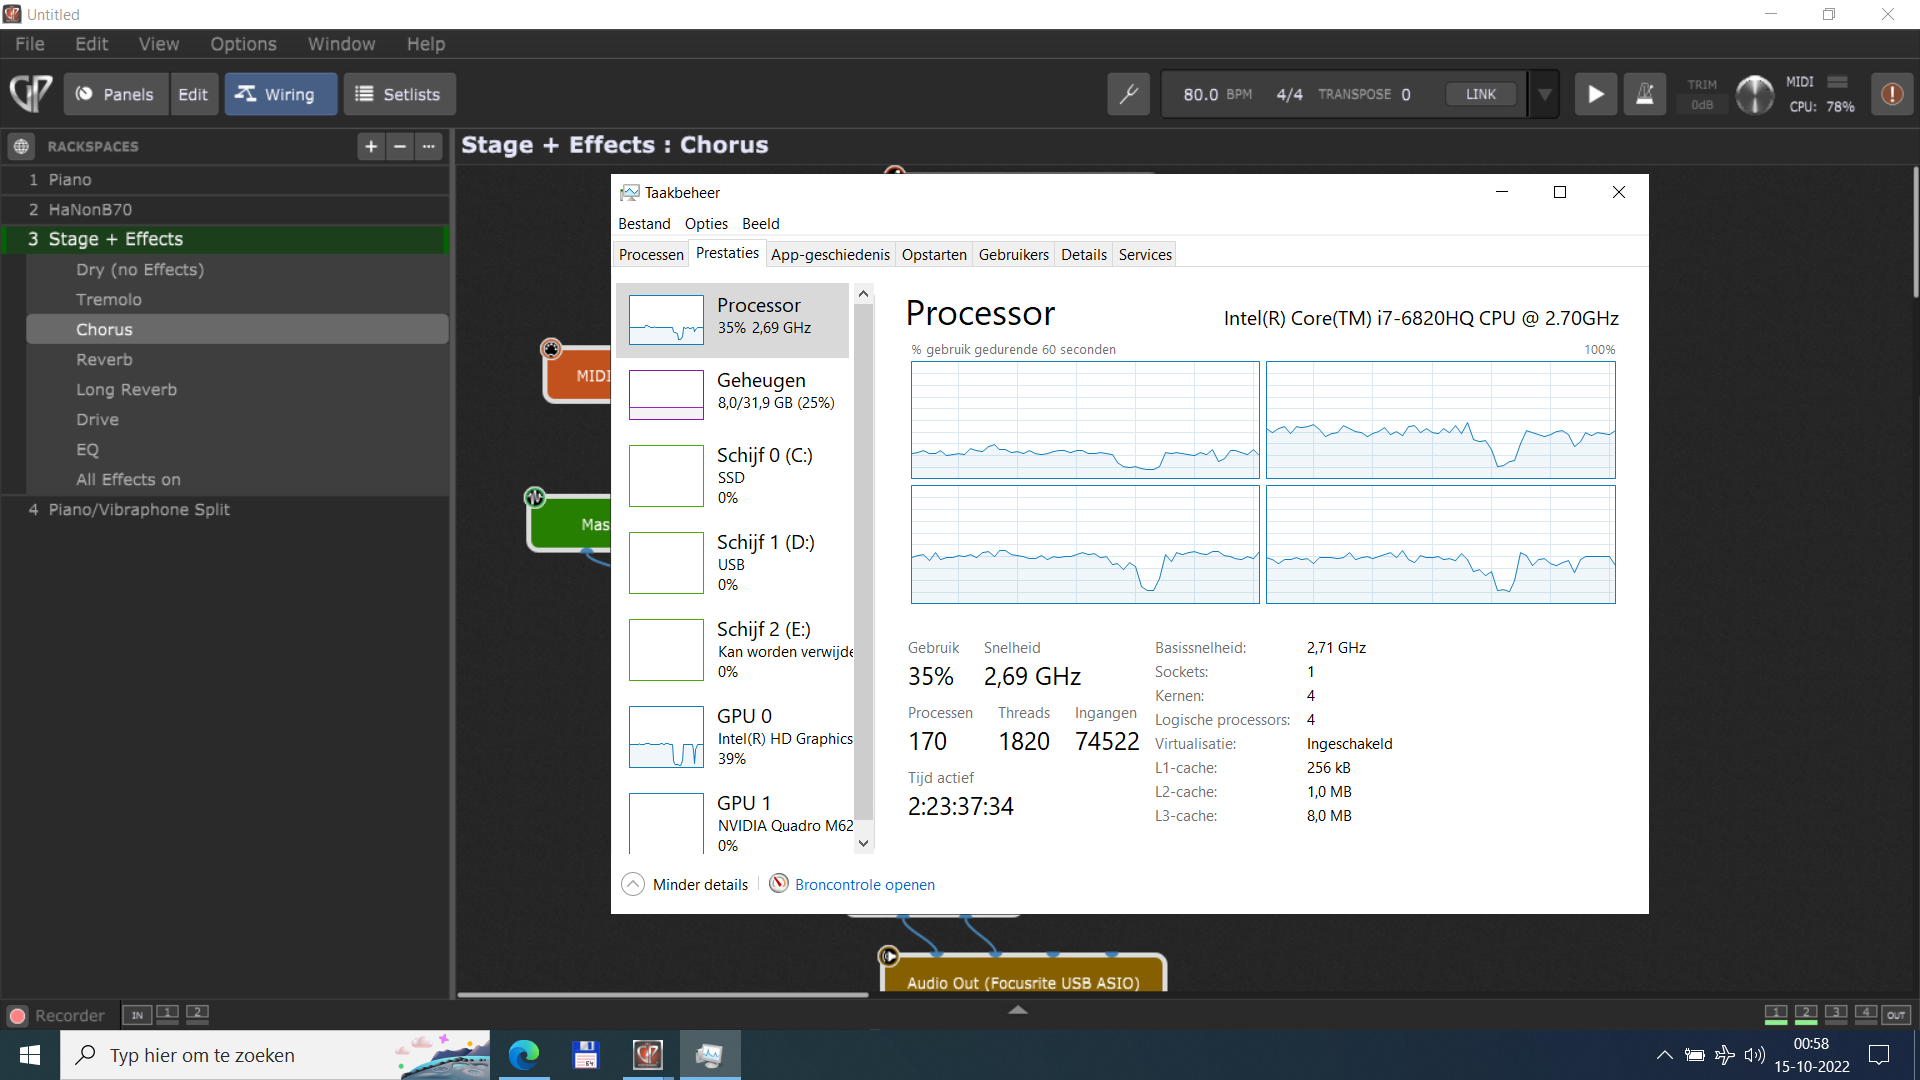
What I notice is that when GP shows above 80% or 90% CPU usage, I have to start worrying about pops/clicks, when it reaches 100% I’m sure get a digitally distorted sound.
However, my CPU meters in Windows do not show anything near 78%, more like 50% at max.
Also, after closing all VST instrument windows (4, one for each NI Massive X instrument), I can add another one, so open windows seem to take a lot of CPU power. I wish there was an easy shortcut for closing them all at once (I now use Ctrl-W but you have to first move to a window and repeat it, and select a button to prevent closing the main screen).
CPU usage indicator - shows the percentage amount of CPU overhead currently being used by Gig Performer for audio processing
In other words, the CPU meter in GP shows only cycles used to process audio data.
Your Windows meters are showing total cycles used by everything (including plugins loaded by GP) and the percentage is also a function of the number of cores. Please review the Microsoft documentation for explanations of their task manager meters.
Yes, because open window have to do GUI processing.
I am afraid I still do not fully understood. Does 78% in my case mean that the total gig performance/audio processing (including plugins according to the documentation) for all cores adds up to 78%? So assuming each of my CPU cores use on average about 30% according to the screenshot, on average 20% for each core is used for Gig Performance/audio processing? (that would make sense).
However, I still don’t understand why I get distorted sound when reaching 100% as every core has CPU power left.
If GUI processing takes so much CPU (understandable, I don’t blame GP at all for that, don’t get me wrong), it would be nice to have one dedicated keyboard shortcut to close all GP child windows except the main GP window.
Ok (I already read it before, but I thought that plugins could use multiple cores). But how can in GP 78% CPU usage being shown while the graphics of the Windows task manager CPU only show around 30% for each core? I would expect one of the cores at least to be 78% in this case (the core GP uses).
That depends … if there is a way I can influence the GP CPU value without changing the gig file (e.g. by moving tasks to other CPUs, or checking if there are still other applications/drivers ‘in the way’).
Yes, that was indeed my conclusion so far (thanks to yours, dhj’s and other people comments as well), but I’m a software engineer (typically diving in a bit deeper than most ).
Also, I don’t want to annoy people, because I might (sure will have) many more questions in the future, and the response time of this forum is better than I ever saw on a forum (thanks for that).
You’re not annoying me --it’s just that this is stuff best left to stackoverflow (and probably explained hundreds of times there )
Why? The core that has the audio processing thread could have 500 other threads running on it. Your task manager is doing sampling of the total population. In that context, high CPU of one thread can easily get lost.
Ok … now I see the issue… so there are spikes upto 100% shown by GP (in my case 78% but when playing more notes, at reaching 100% distortion can be heard), which is actually happening on just one core, the core on which GP runs its audio processing. However, because of the (coarse) interval timing of the sampling method of Windows Task Manager, the CPU graphs does not measure (and thus show) them.