This one is created by @schamass for grins and can serve as a hearing test over the complete frequency spectrum.
Note: the result won’t have any “quantitative” meaning
- as long as the whole signal chain and headphones/speakers are not calibrated,
- and provided that your equipment is able to reflect the produced frequencies (30Hz-18kHz),
… but the result might well show (in a relative way) what frequency-bands you can hear.
Prerequisite: you must install Melda’s free MOscillator plugin (the VST version is used in this gig file).
Download: Ear-Graph.gig (1.0 MB)
–
Explanation:
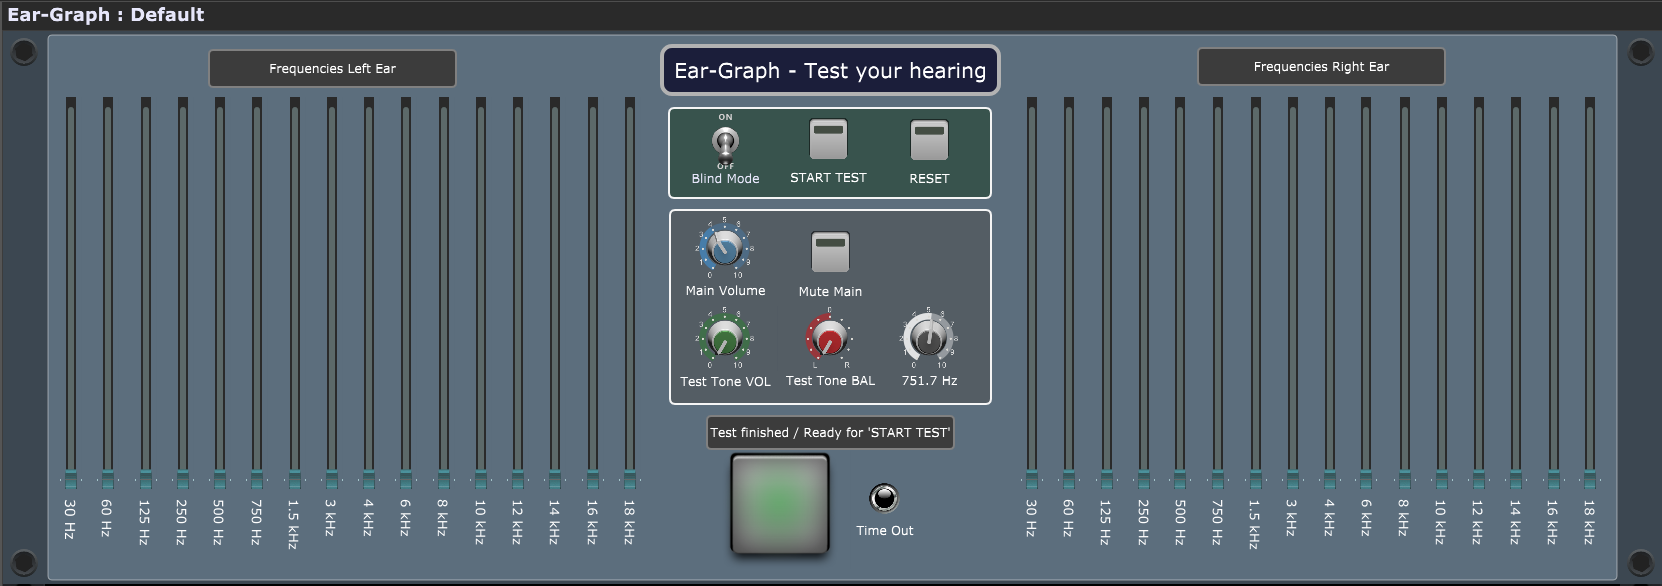
As can be seen from the screenshot, there are 16 frequency bands on each side (L/R) to picture some kind of a “graph” when the test runs through.
While the test cycles are running, the actual band and side (L/R) will then be selected randomly until each of the 32 combinations (16 bands on two sides) is done.
- Blind Mode will hide every widget which would show you what’s actually going on (blind test) as soon as the test is started
- START TEST will prepare the tests to be started (if “Blind Mode” is enabled, most of the widgets will then disappear)
- RESET will set all the faders to zero and start with test cycle no. 1 again
- Main Volume controls the overall audio output (set how it’s best for your ears/equipment)
- Mute Main will mute the audio
- Test Tone VOL is controlled by the script and fades in the actual test tone (fader) until it’s stopped (you heard the tone) or it timed out (you didn’t hear the tone).
- Test Tone BAL is set randomly by the script
- Frequency knob is controlled by the script and it sets the oscillator plugin to the desired frequencies randomly
The big pad/button on the bottom is then used to either step to the next test cycle (frequency band), or while the test cycle is running (fader is climbing) it s used to stop the actual cycle (you heard the tone) and freeze the fader at the corresponding position.
If the you can’t hear the tone and the particular volume/fader climbs to “full”, the actual cycle will time out (see LED indicator) and it will step on to the next cycle.
When all of the 32 test cycles are done, the test will stop and you can see the result (if “Blind Mode” is enabled, the widgets will be visible again)
Though even if it’s not a scientific instrument, it’s interesting to see if your ears are “golden” or “wooden”.